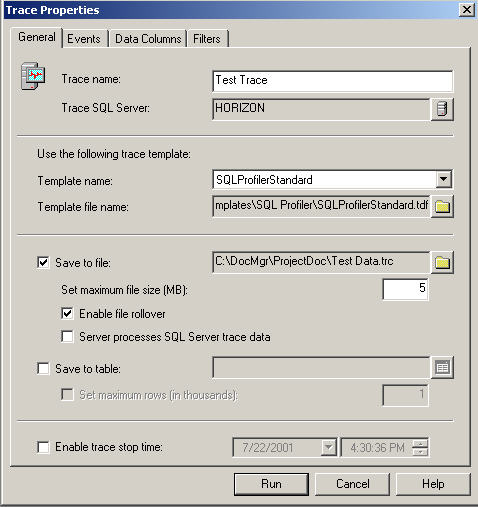
Templates
Trace templates come with a predefined set of events,
data columns, and filters or you reuse a previously saved trace definition.
One template that comes with SQL Server is SQLProfilerSP_Counts, which
lets you trap invocations of stored procedures.
An important advantage of saving the trace output to a file is that when you reopen the file later for examination or for replay, it loads asynchronously and you can start examining the file while it's still loading.
Maximum file size - set from 1MB to 1000MB
Enable file rollover
If you specify a maximum file size but don't enable the file-rollover option, SQL Server stops writing events to the file after the file reaches the size you specified. Newer events do not overwrite previous events so you will get only the first events that fit the specified file size, events will still write to the screen but they will not be saved.
If you enable the file-rollover option, as soon as the trace file reaches the specified maximum size, SQL Server creates a new trace file.
The first trace file's name is the name you specified in the "Save to file" text box. SQL Server uses three elements to construct the next file's name: the file name you specified, an underscore, and a number, starting with 1 and incremented by 1 with every new file. For example, suppose you specify C:\traces\mytrace.trc as the trace filename and you leave the default maximum file size of 5MB. If you trace 17.5MB of trace data, you'll have four files: mytrace.trc, my-trace_1.trc, mytrace_2.trc, and mytrace_3.trc.
Server processes SQL Server trace data
This specifies that the server, not the client, should handle the trace data. This means that a server-side trace file writer, based on the transaction log writer, is responsible for writing the trace data to the file. If you enable server-side processing, you're guaranteed to capture all events that you requested. This option can degrade the server's performance. However, not enabling this option means that all events may not be captured under stress conditions.
Save to table
Saving the trace output to a table lets you analyze the trace data by using T-SQL queries or even a Microsoft Excel pivot table or Analysis Services cube to manipulate the trace data dynamically.
If you send the trace output to a file instead of a table, you can use the function fn_trace_gettable() to return the trace data in table format. The fn_trace_gettable() function accepts the trace filename and optionally a maximum number of files to process as parameters; it returns a rowset containing the trace data. For example, suppose that Profiler generated the following three files for a certain trace: C:\traces\mytrace.trc, C:\traces\mytrace_1.trc, and C:\traces\mytrace_2.trc. To copy the content of only the first file to a table, you would use fn_trace_gettable(), specifying 1 in the second parameter, as follows:
SELECT * INTO #Mytrace
FROM ::fn_trace_gettable('C:\traces\mytrace.trc', 1)
See also: Microsoft article "BUG: fn_trace_gettable Function Cannot Read Rollover Files Generated by SQL Profiler"
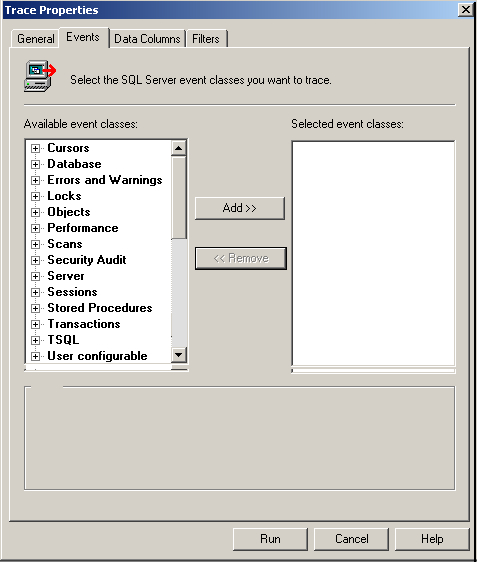
See also the SQL Server Books Online - Monitoring with SQL Profiler Event Categories
Database
Data File Auto Grow, Data File Auto Shrink, Log File
Auto Grow, and Log File Auto
Performance
Execution Plan, Show Plan Text and Show Plan All events.
There are also four Degree of Parallelism events, one for each Data Manipulation
Language (DML) statement (SELECT, INSERT, UPDATE, DELETE). If you're tracing
a SQL Server 2000 server, any of the four Degree of Parallelism events
is sufficient to capture all types of DML statements. The statement type
appears in the EventSubClass data column.
Security Audit
Includes 21 database audit events that let you track failed
or successful login attempts; the addition and removal of logins, database
users, and database roles; the use of statement and object permissions;
backup and restore operations; the issuing of DBCC commands; and more.
In addition, this category gives you 10 user-configurable events.
Stored Procedures and TSQL
Starting and Completed events are two of the most commonly
traced events.
Starting events are important when you want to track the existence and
chronological order of certain activities. For example, if you want to
analyze the types of queries issued against your server during various
periods of the day, you need to capture the text of those queries and
the time they were issued. For this purpose, capturing a Starting event
is sufficient.
Completed events are important when you want to get performance measures of activities such as CPU time and logical disk reads, because performance measures are known only after activities have finished. For example, you would use Completed events to locate slow-running queries. In some situations, you'd want to capture both Starting and Completed events. For example, suppose you're troubleshooting a certain client application that experiences a lot of timeouts, such as lock request time out period exceeded errors. You need to pinpoint the queries that start but never finish. If you capture only Completed events, you won't get the queries that experienced timeouts because those queries never completed. However, you could look for Starting events that don't have corresponding Completed events to find the queries that never finished.
You can divide Starting
and Completed events by their level of detail; we call these events the
less granular (not so detailed) and more granular (very detailed) events.
The less granular events include RPC:Starting, RPC:Completed, SP:Starting,
SP:Completed, SQL:BatchStarting, and SQL:BatchCompleted. SQL Server generates
these less granular events when remote procedure calls, stored procedures,
and batches start and finish.
The more granular events—SP:StmtStarting, SP:StmtCompleted, SQL:StmtStarting,
SQL:StmtCompleted—for individual statements inside stored procedures
and batches.
In SQL Server 2000, regardless of whether you select to trace statements
under SQL or SP, SQL Server generates only one kind of event—SQL.
You can't request to trace only individual stored procedure statements
or only individual batch statements.
When tracing a SQL Server 2000 machine, treat the SP:StmtStarting and
SP:StmtCompleted events as redundant, and be aware that when you trace
the SQL:StmtStarting and SQL:StmtCompleted events, you actually get both
stored procedure and batch statements.
See also the SQL Server
Books Online - Monitoring with SQL Profiler Event Categories and Monitoring
Server Performance and Activity
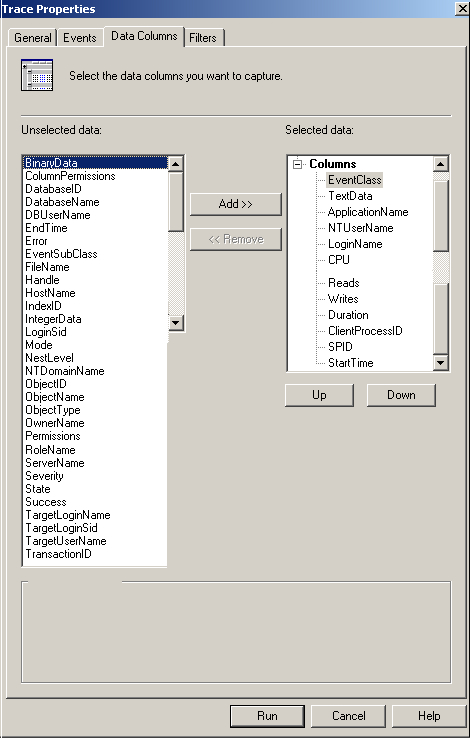
You choose from 43 data
columns to give you information about the events in your trace. Not every
data column is relevant for every event.
Two data columns—EventClass, which shows the type of event, and SPID,
which contains the server process ID—are mandatory. The other 41
data columns are optional.
On the Data Columns tab, your
results are grouped by the order in which you select the columns. You
will not get a seperate caption for each group.
SQL Server 2000 Profiler has separate data columns for object and database
IDs and for object and database names.
Data columns generally fall into three groups: performance, informative, and event-specific.
- Performance data columns include CPU, Duration, Reads, and Writes.
- Informative data columns give you information such as the start or end time of the event, database ID, login name, and database username.
- Event-specific data columns provide different information for different events—and no information at all for some events and include EventSubClass, IntegerData, and BinaryData.
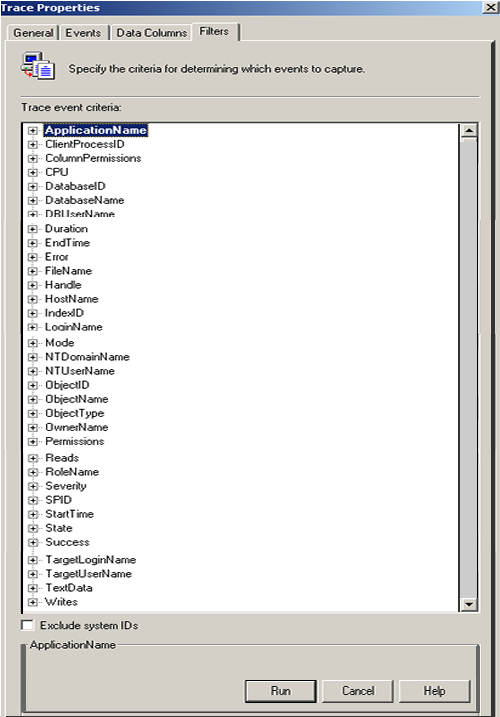
Let you limit the events that
a trace collects.
Trace Event Criteria
You can place
filters on 34 of the 43 data columns. The data columns you
can't filter are BinaryData, EventClass, EventSubClass, IntegerData, LoginSid,
NestLevel, ServerName, TargetLoginSid, and TransactionID.
Allows you to specify mulitple values in one filter. Each filter lets
you specify one or more combinations of the following options: Like, Not
like, Equals, Not equal to, Greater than or equal, and Less than or equal.
However, not all event criteria options are available with each filter.
Textual data columns such as ApplicationName, DatabaseName, and HostName
let you specify the Like and Not like options.
Numeric data columns such as DatabaseID, CPU, and SPID let you specify
the Equals, Not equal to, Greater than or equal, and Less than or equal
options.
Temporal data columns, which include StartTime and EndTime, let you specify
only the Greater than or equal and Less than or equal options.
Exclude system IDs
Lets you exclude events that reference system objects.
By selecting this check box, you add the filter ObjectID >= 100. Because
most system objects have an object ID that is less than 100, you eliminate
most—but not all—references to system objects. This filter can
considerably reduce the number of traced events because SQL Server itself
performs a lot of activity against system objects.
Post-Filter Events
To efficiently
examine trace output, you don't necessarily need to pre-filter—place
filters when you define a trace. By specifying the filters after you reopen
the trace output file in Profiler, you can post-filter events that you've
already collected. The problem with pre-filtering is that you might accidentally
filter out events that are vital for your examination. For example, if
you're trying to find the cause of an increasing number of deadlocks but
you don't know which SPIDs are involved in the deadlocks and which application
issues the code that causes the deadlocks, pre-filtering on certain process
IDs or certain applications might exclude the events that you need to
examine.
As a rule, filter out what you're certain you don't need, but if you're not sure, don't specify a filter. By reopening the trace file and using post-filters, you can examine the trace output more dynamically.